Embedded systemsDecember 2024 - April 2025
Air Quality Monitoring Device
IoT Environmental Sensing with Solar Power Integration
System Overview
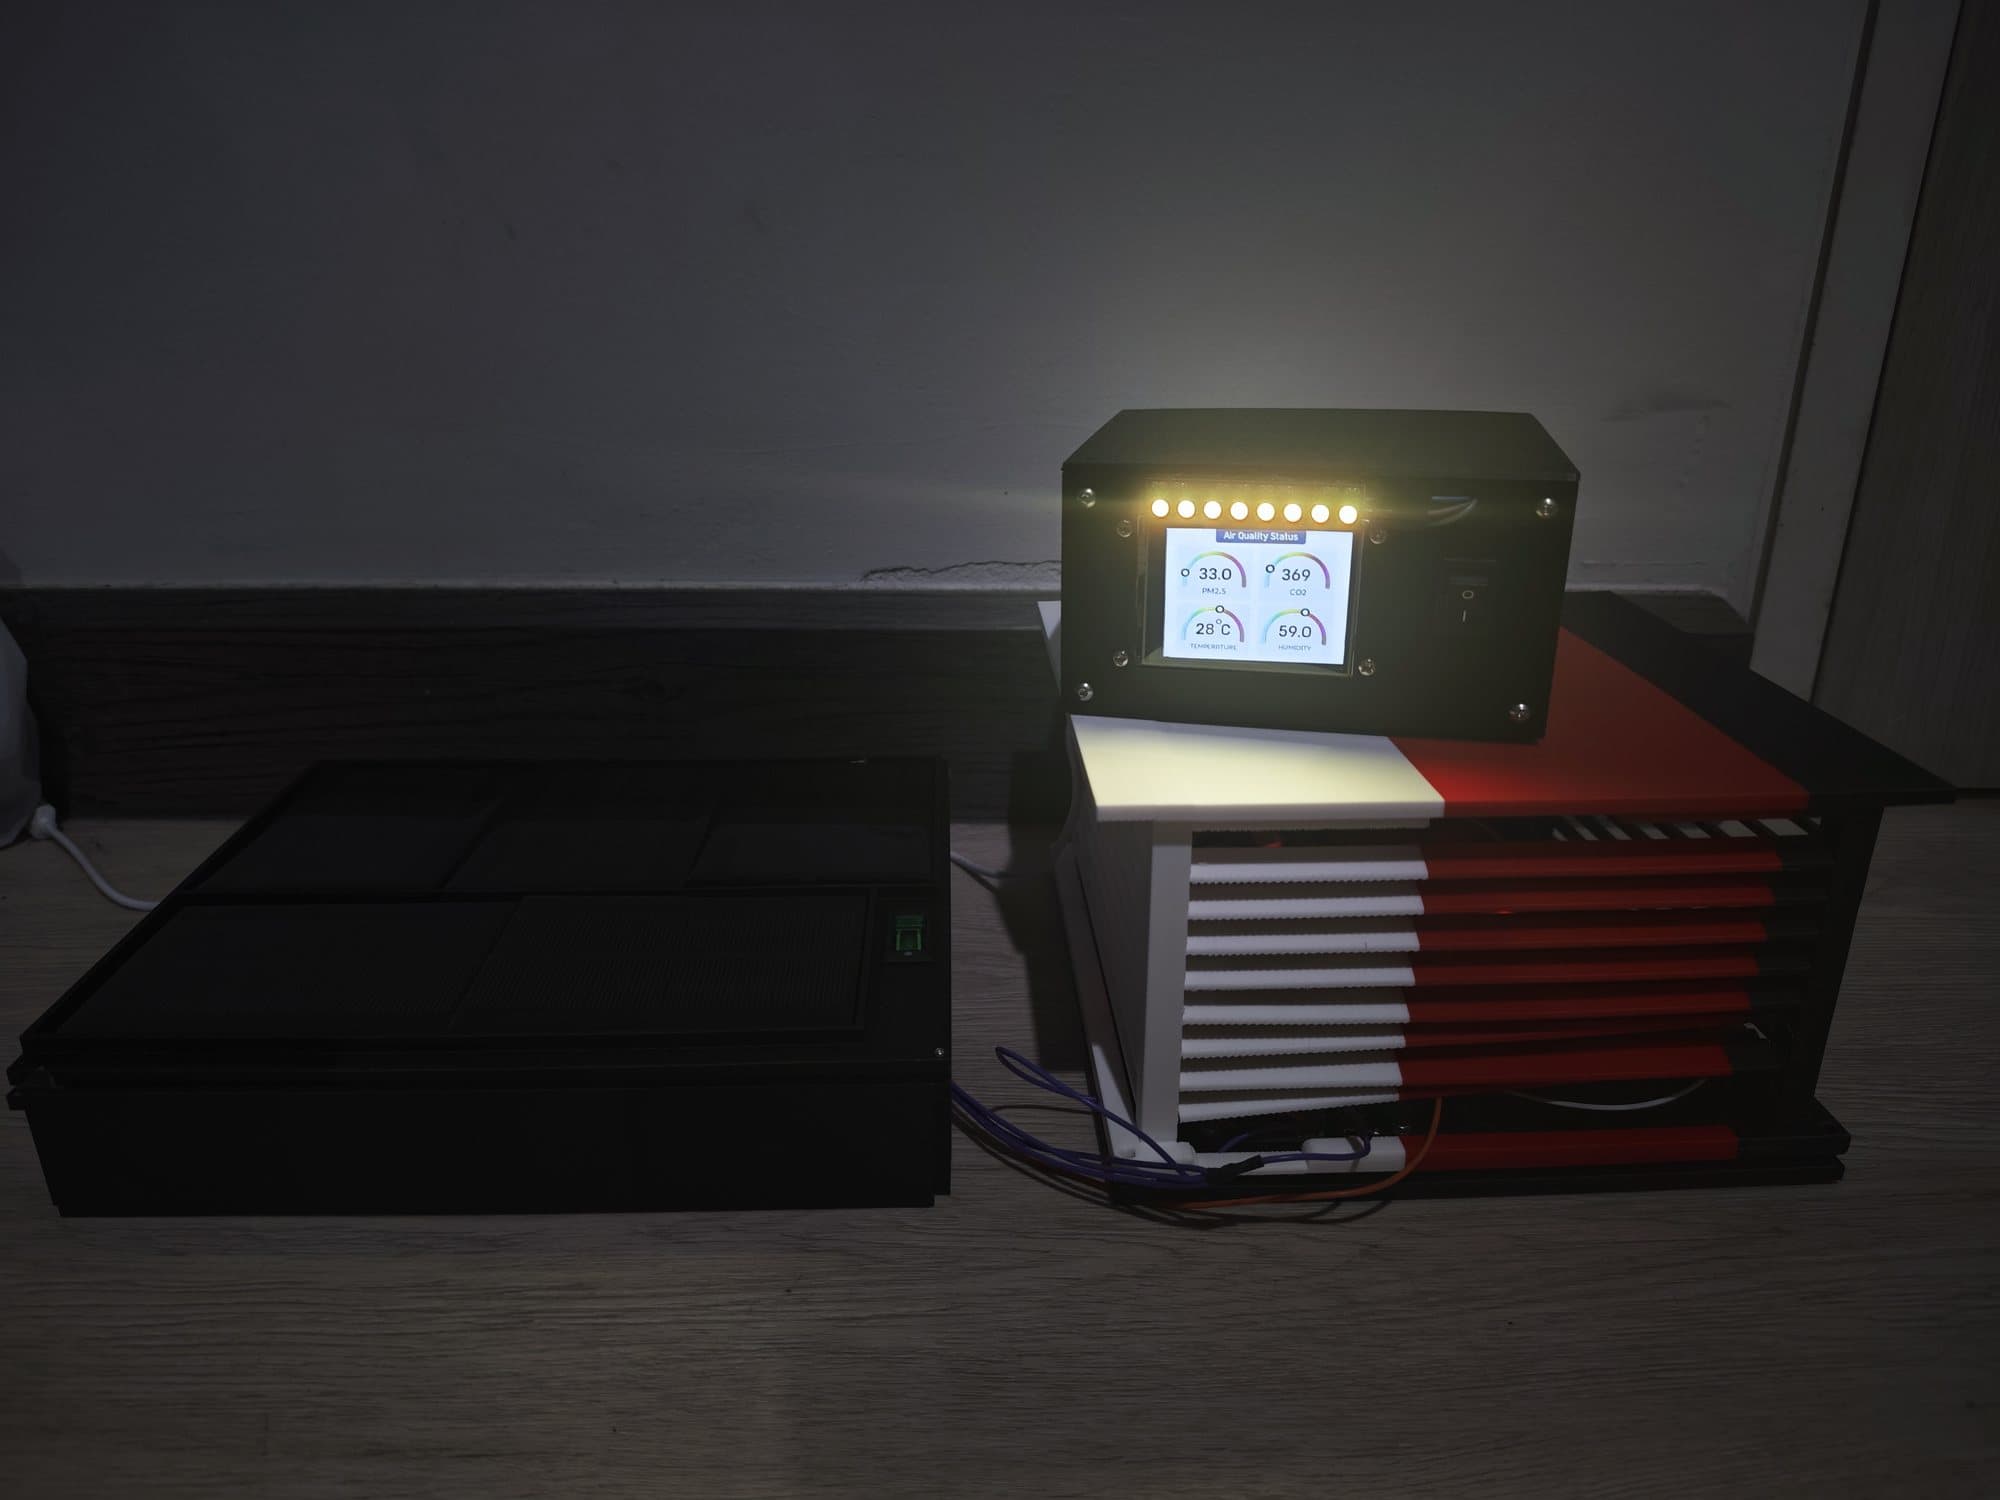
Two ESP32 units connect environmental sensing to a portable LCD and PM2.5 indicator LEDs.
The sensor measures particulate matter, CO2, temperature, and humidity using rechargeable power with solar charging. The presentation records lab comparisons and power tests, alongside unstable readings, limited wireless range, and weather-constrained solar evaluation.
How it actually works
From sensor bytes to a warning light
Follow one reading through the airlink firmware, from the particulate sensor's serial frame to the monitor's LEDs and a laptop log, then compare it with the team's lab and campus measurements.
Things to try
- In Show and warn, drag PM2.5 to exactly 35 and watch the LEDs keep their colour.
- In Read CO2, move the voltage drop and see how fast the reading climbs.
- In Field data, open Campus PM2.5 and switch between Outside HM lab and KMITL dorm.
Built from the project's own code and documents.from code: A constant or rule copied from the project's repositoryfrom report: A value from the project's report or presentationsimulated: Computed in your browser by running the project's logic
How it works
Measure air conditions where people are working.
- 1
Sample environmental conditions
The sensor ESP32 collects readings from the particulate, CO2, temperature, and humidity sensors housed in the ventilated sensing unit.
- 2
Transmit readings wirelessly
Send the sensor data to the receiver ESP32, with the system also supporting viewing readings on a connected computer.
- 3
Display local air-quality information
Present readings on the receiver's LCD and control its indicator LEDs according to the measured PM2.5 level.
Project Demo
The project's own demonstration footage.
Engineering features
Built a two-unit air quality monitor on ESP32s, with a solar-charged sensing box and a portable receiver linked wirelessly.
Integrated PM2.5, CO2, temperature, and humidity sensors into a single monitoring device and transmitted readings to a receiver unit, with optional laptop monitoring.
Built a portable receiver with an LCD and LEDs whose colour follows PM2.5 thresholds set in the firmware.
Ran lab and campus tests against a purifier's readings and measured charging and battery runtime, documenting the sensor offset and range limits.
Inside the build
The control logic, integration and design decisions, one note at a time.
01Separate sensing and display hardware
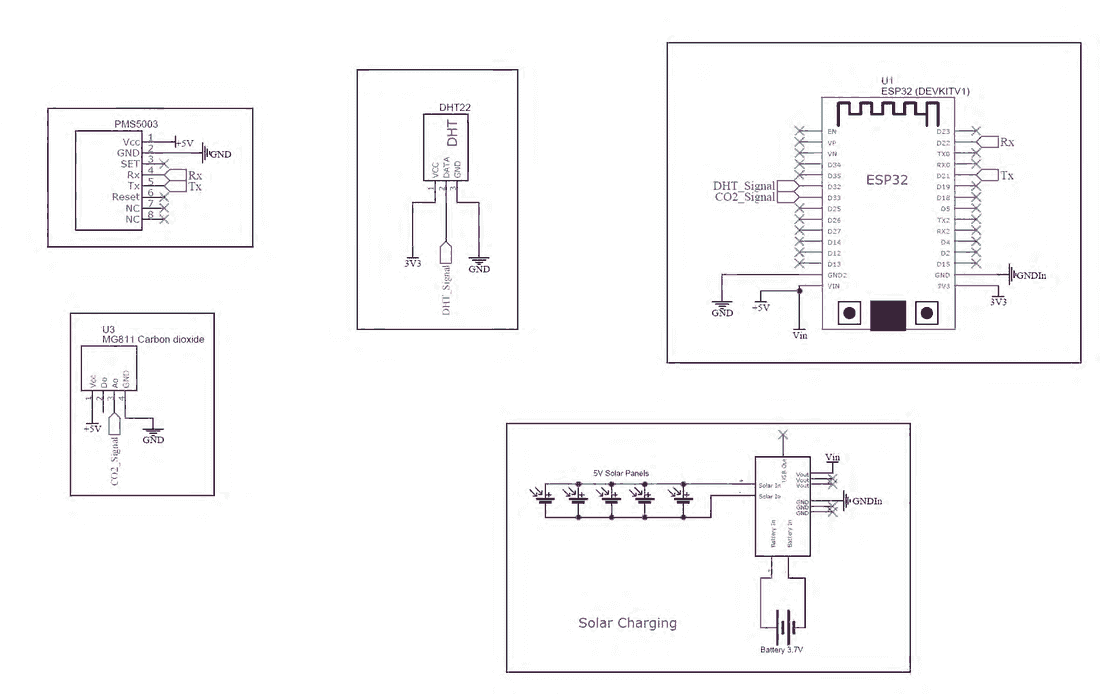
The system uses two ESP32 boards, a PMS5003 particulate sensor, an MG811 CO2 sensor, and a DHT22 temperature/humidity sensor. The receiver combines an LCD with an LED strip, allowing the sensing hardware and the user-facing display to occupy different locations.
02Solar charging evaluated alongside load
Parallel solar panels feed the sensor charging system, and a rechargeable battery supplies the electronics through power conversion hardware. The presentation distinguishes component-based power calculations from measured charging and discharge tables. Solar output is shown with and without load, and cloudy-weather testing constrains the charging evidence.
03Housing for airflow and monitoring
The sensor enclosure uses louvers for ventilation and a roof overhang intended to reduce direct rain entry. A separate solar box houses the charging arrangement. The receiver enclosure provides access to the screen and indicator lights, keeping the sensing, charging, and monitoring functions in distinct physical units.
Build artifacts
Figures taken from the project's own report or presentation.
Evidence & limitations
What the project documents show, and where each claim comes from.
Lab comparisons and campus measurements
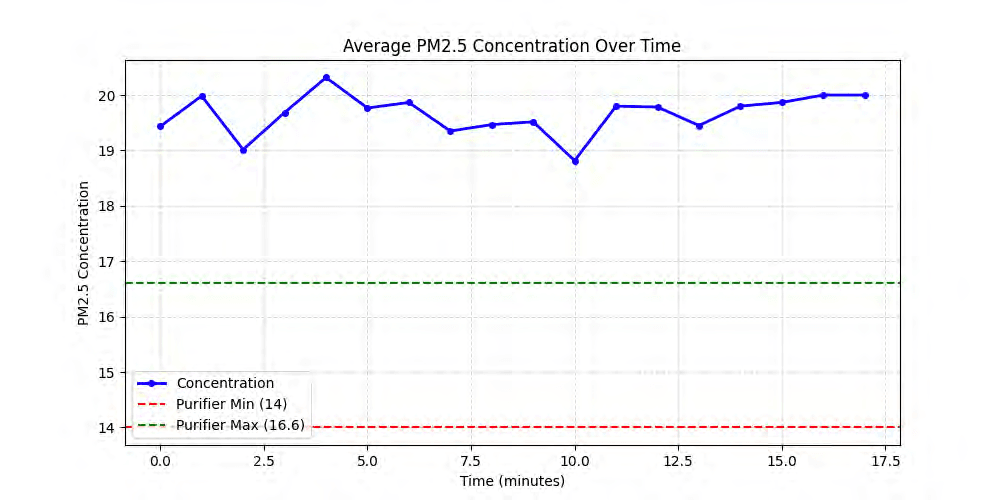
The presentation plots PM2.5 and CO2 readings in the HM lab and at campus locations. The PM2.5 lab comparison shows a positive offset from the purifier's readings; outdoor plots were taken at different times of day, so they do not establish a simultaneous location comparison.
Power and communication results
Charging and discharge tables document USB charging, solar charging, and battery operation. The conclusion reports data transfer between two ESP32 boards and a PC, plus display and LED operation, while acknowledging transmission-range and solar-testing problems.
- Air monitor project presentation
PDF pages 6-18: objectives, design, and power calculations; 20-29: tests; 30-31, 34: limitations and conclusion.
- Airlink source repository
- Project demonstration
Linked in the presentation and supplied portfolio.
CAD & mechanical models
Drag to rotate each part; pinch, or hold Ctrl or ⌘ and scroll, to zoom. Models load as you reach them.
Air Monitoring Housing
STLLoading 3D preview…
Air Sensing Housing
STLLoading 3D preview…
Solar Charger
STLLoading 3D preview…
Project Resources
The original documents behind this case study.
Hiring for robotics or embedded work?
I'm looking for internships. The résumé has the short version.