SoftwareJuly 2025 - November 2025
Inventory Management System
Full-Stack Solution with AI-Powered Sales Forecasting
System Overview
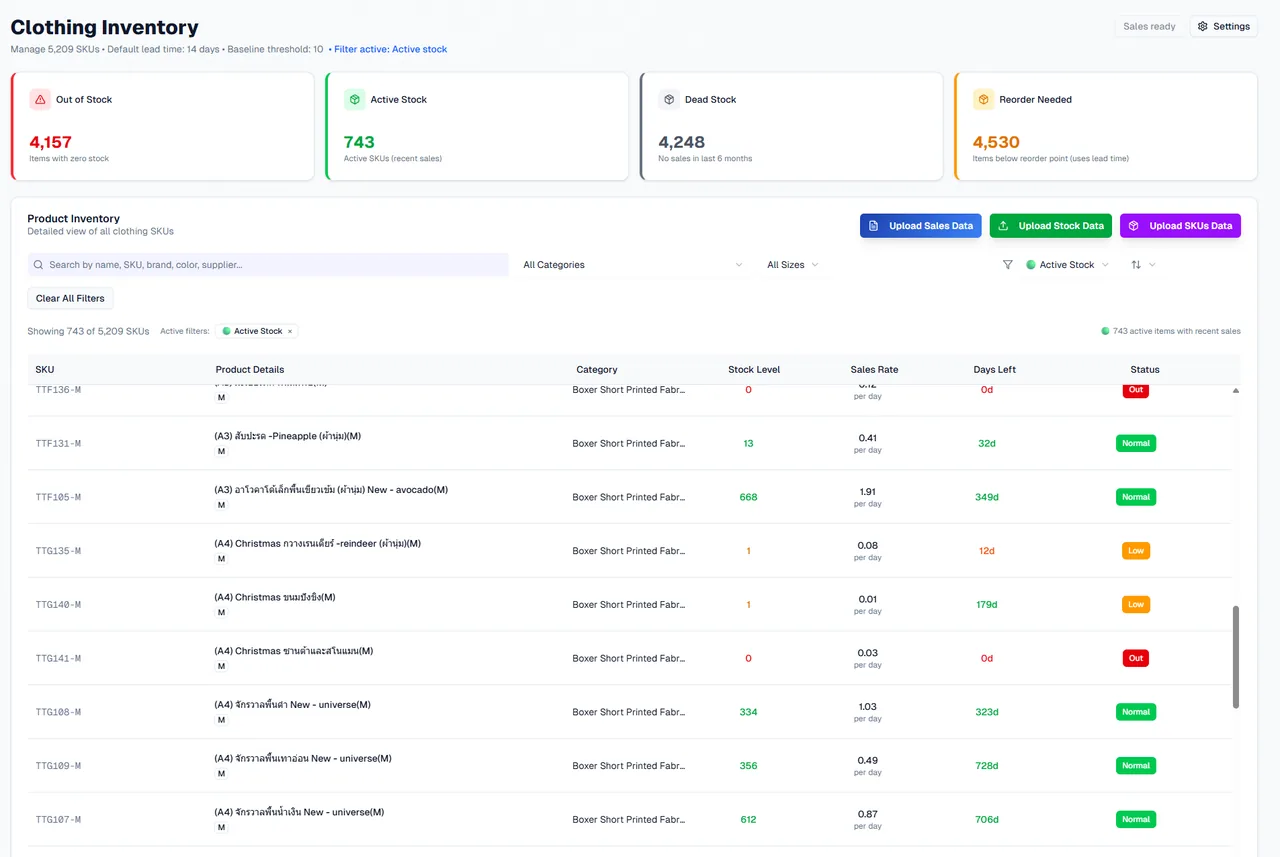
This desktop system turns uploaded apparel sales and stock files into SKU status, restock alerts, analytics, and Prophet forecasts.
It connects a Next.js/React interface to FastAPI and Supabase PostgreSQL, packaged with Electron, bringing stock information and restocking decisions into one interface for two apparel companies.
How it actually works
How StockFlow decides what to reorder
The app's own reorder, status and forecasting code, run in your browser with its defaults and checked against the report's screenshots of 5,209 real SKUs.
Things to try
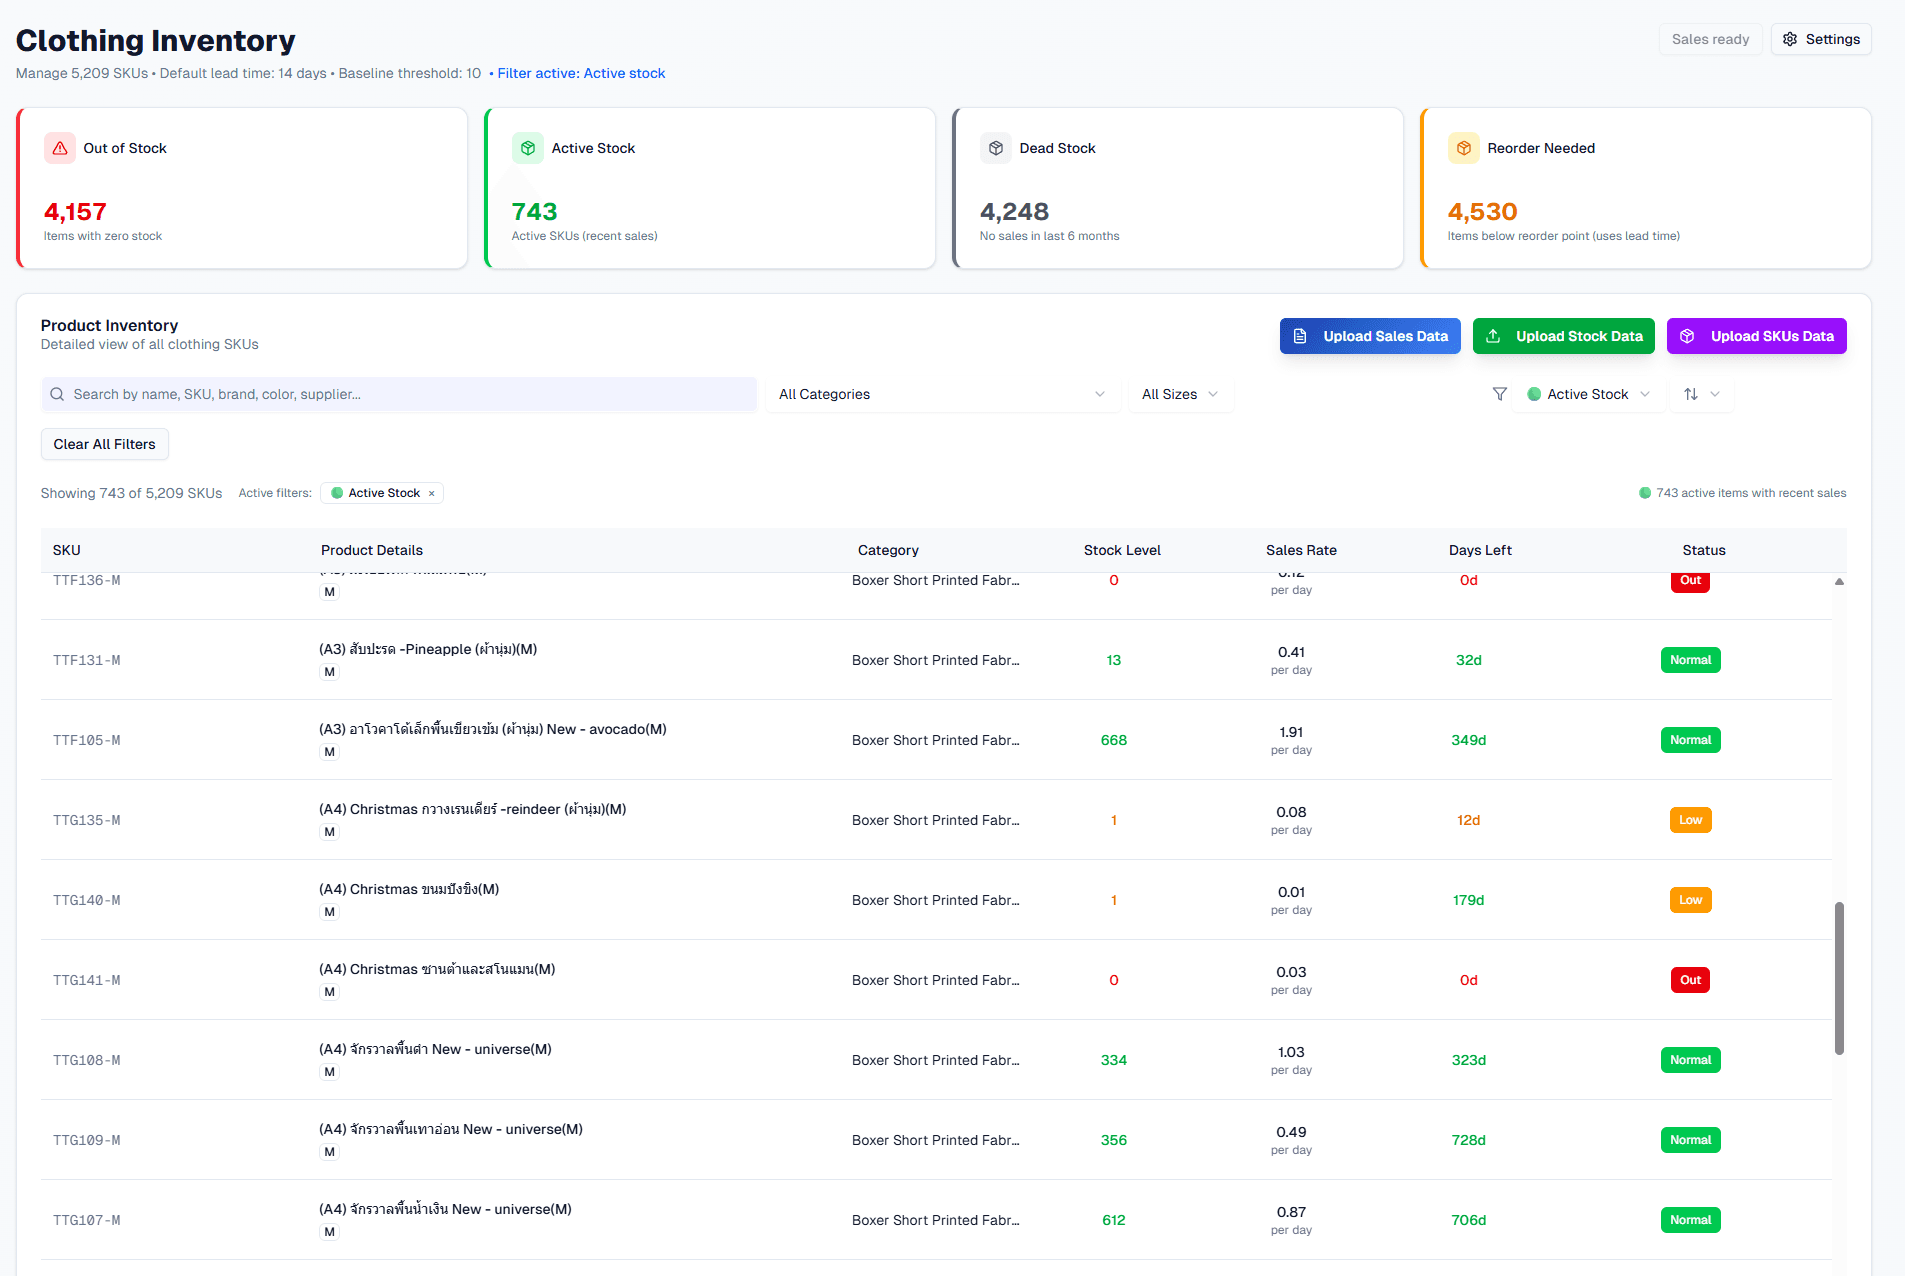
- Pick TTG140-M and check its 179 days against the report.
- In 4 Status and alerts, change the Low-stock threshold and watch which rule fires first.
- Open 6 Prophet forecast and compare MAPE across categories.
Built from the project's own code and documents.from code: A constant or rule copied from the project's repositoryfrom report: A value from the project's report or presentationsimulated: Computed in your browser by running the project's logic
How it works
Turn separate business files into inventory decisions.
- 1
Upload business data
Users provide sales, stock, and SKU files in the supported CSV or Excel formats to refresh the application data.
- 2
Clean and store records
The ETL pipeline cleans and validates uploads, then loads structured records into the sales, stock, and SKU tables.
- 3
Identify stock requiring attention
Calculate sales rates, remaining inventory days, and reorder status; display searchable SKU records, summaries, and low-stock notifications.
- 4
Explore demand forecasts
Select a SKU, category, or sales channel and forecast period to view Prophet predictions alongside inventory and sales analytics.
Project Demo
The project's own demonstration footage.
Engineering features
Developed a full-stack inventory management and sales forecasting system for two partner companies.
Implemented ETL pipelines, low-stock alerting, and advanced SKU/sales analytics.
Built REST APIs, PostgreSQL schemas for sales, stock and SKUs, and Prophet forecasting with a 30-day held-out error check.
Delivered the system as a standalone desktop app and provided user onboarding.
Inside the build
The control logic, integration and design decisions, one note at a time.
01A database-backed desktop architecture
Sales, stock, and SKU records are stored separately in Supabase PostgreSQL after upload validation and normalization. FastAPI retrieves these records for analytics and forecasting. The Next.js/React interface presents inventory, product details, and prediction pages, with Electron packaging the interface as a desktop application.
02Explainable reorder and stock-status rules
The reorder point combines a baseline threshold with lead time multiplied by daily sales rate. Remaining days are derived from stock divided by sales rate, while recent sales determine active or dead stock. Users can configure thresholds, lead time, and the sales windows used by these calculations.
03Forecasting at the user's chosen level
Prophet processes historical sales prepared by the ETL pipeline, and the prediction page lets users choose SKU, category, channel, and horizon. Inventory summaries separately expose stock coverage, category trends, and SKU performance, giving forecasts context alongside the current stock position rather than presenting predictions in isolation.
Build artifacts
Figures taken from the project's own report or presentation.
Evidence & limitations
What the project documents show, and where each claim comes from.
Implemented screens and company feedback
The report shows inventory, settings, analytics, product-detail, and prediction screens. It records upload processing, stock alerts, and positive feedback from both companies during testing and demonstrations. Its discussion also reports variable forecast accuracy, including high error in some cases, without supplying numerical evaluation results.
- Inventory management project report
PDF pages 10-15: problem and architecture; 18-25: implementation; page 18 (printed page 9), section 3.3: Lucky's database, frontend, and stock notification attribution; 26-28: results and limitations.
- Stockflow source repository
- Project demonstration
Linked from the supplied portfolio.
Project Resources
The original documents behind this case study.
Hiring for robotics or embedded work?
I'm looking for internships. The résumé has the short version.